 PmaControl
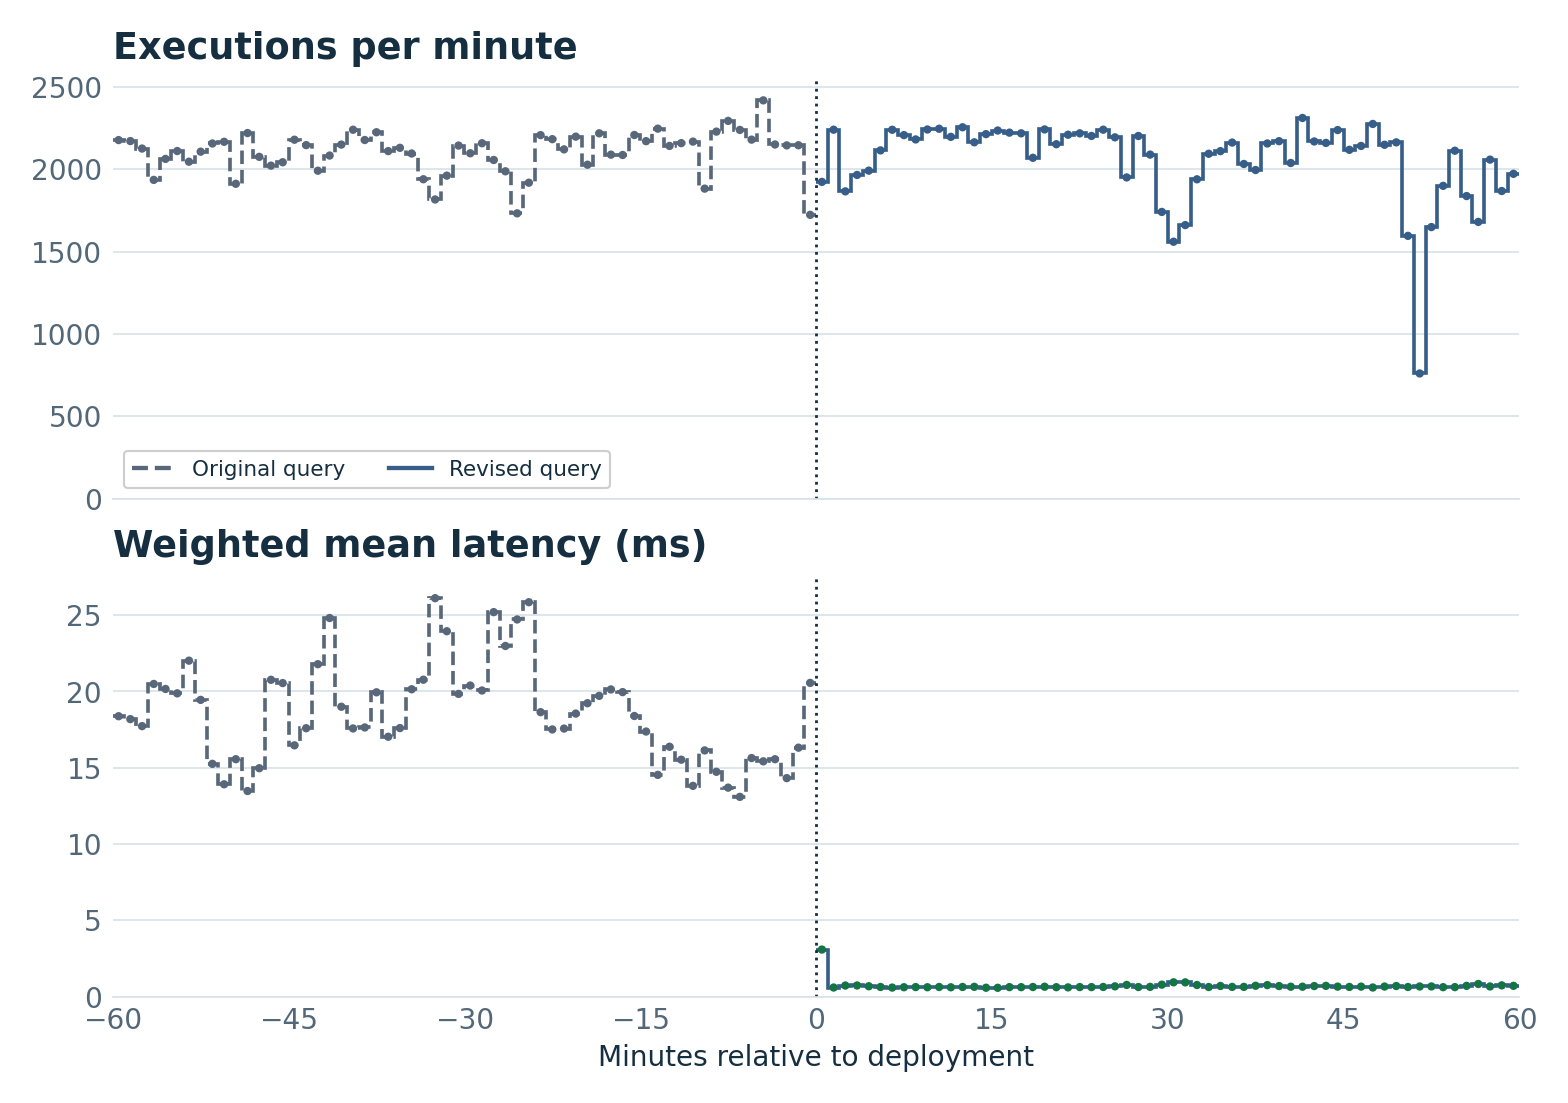
With 3,759 distinct names across 3,791 rows, the name column in ts_variable already did almost all the filtering. For mysql_available, it matched exactly one row. Adding v.`from` = 'mysql_server' kept that same row. A negligible speedup seemed like a reasonable prediction. Yet at roughly 2,100 calls per minute, average production latency fell from 18.43 to 0.70 ms. What did MariaDB gain when the second predicate removed zero additional rows for this metric?
Before recording service availability, PmaControl reads the previous value to detect a change of state. In the hour before deployment, this small lookup consumed 2,326 seconds of cumulative SQL time. The next hour it consumed 87, with a similar number of calls. Only one join condition changed.
Two hours around deployment
On 21 November 2026 at 17:26:47 Paris time, the collector started using the revised query. Changing the SQL created a second digest in Performance Schema. Following the old digest alone makes executions appear to drop to zero. We add counter differences from both digests in one-minute buckets to track the work the service actually performs.

Each series has 120 points, one per minute. The top panel shows the executions in each minute. The bottom panel shows mean latency for those same calls. The vertical dotted line marks deployment. Calls from the other version near the transition remain included.
In the tables, green (✓) marks an improvement and red (✗) a regression when the larger value is strictly more than twice the smaller one. Durations must also differ by at least 1 ms. Call volumes describe workload. The threshold is a reading aid. The chart lines distinguish the two periods. Each latency point after deployment is compared with the previous hour’s weighted mean. The cumulative chart uses a reference at matching volume, and each benchmark pair uses its own initial time.
| Metric | Hour before | Hour after |
|---|---|---|
| Estimated calls | 126,229 | 123,241 |
| Executions per minute | 2,104 | 2,054 |
| Weighted mean latency | 18.43 ms | ✓ 0.70 ms (÷26.25) |
| Cumulative SQL seconds | 2,326.5 | ✓ 86.5 (÷26.88) |
| Executions per SQL second | 54 | ✓ 1,424 (×26.25) |
| Rows examined per call | 2.99 | ✓ 1.00 (÷2.98) |
Efficiency is lookups per second of cumulative SQL time. It rose from 54 to 1,424. Latency fell 96.2%, while the observed execution rate fell only 2.4%. Efficiency describes lookup cost. Actual throughput also depends on polling frequency and concurrency.
What the query looks up
For the requested server, ts_max_date supplies the last timestamp for a measurement file. ts_file identifies the file and ts_variable identifies the metric. mysql_server excludes deleted servers. The outer join then reads the integer value at that time for the same variable and server. A missing measurement can produce NULL at this last join.
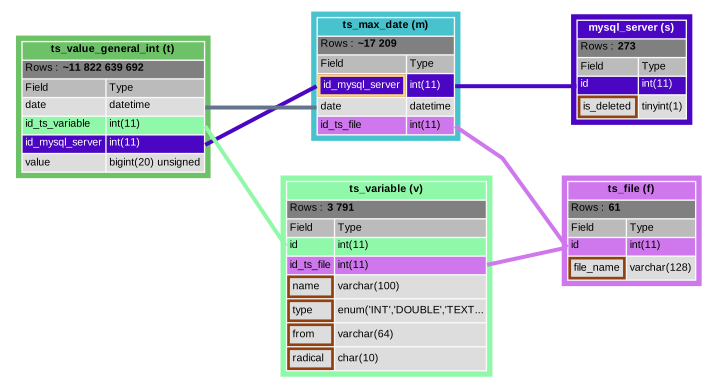
PmaControl’s diagram for the revised query. The arrows connect the join columns. Brown outlines mark fields with filter conditions, including ts_variable.from. A ~ marks a row count estimated at the time of capture.
Definitions of the five tables
These are the SHOW CREATE TABLE results from the MariaDB instance used in this case study. In ts_variable, the UNIQUE KEY line lists the two columns used by the revised query in index order.
SHOW CREATE TABLE ts_variable;
CREATE TABLE `ts_variable` (
  `id` int(11) NOT NULL AUTO_INCREMENT,
  `id_ts_file` int(11) NOT NULL DEFAULT 3,
  `name` varchar(100) NOT NULL,
  `type` enum('INT','DOUBLE','TEXT','JSON','') NOT NULL COMMENT '1 => int, 2 => double, 3 => text, 4=> json',
  `from` varchar(64) NOT NULL,
  `radical` char(10) NOT NULL,
  `is_derived` int(11) DEFAULT 1,
  `is_dynamic` int(11) DEFAULT 1 COMMENT 'only for global variables',
  PRIMARY KEY (`id`),
  UNIQUE KEY `name` (`name`,`from`),
  KEY `ts_variable_ibfk_1` (`id_ts_file`),
  KEY `from` (`from`),
  CONSTRAINT `ts_variable_ibfk_1` FOREIGN KEY (`id_ts_file`) REFERENCES `ts_file` (`id`) ON DELETE CASCADE ON UPDATE CASCADE
) ENGINE=InnoDB AUTO_INCREMENT=39387 DEFAULT CHARSET=latin1 COLLATE=latin1_swedish_ci;
SHOW CREATE TABLE ts_file;
CREATE TABLE `ts_file` (
  `id` int(11) NOT NULL AUTO_INCREMENT,
  `file_name` varchar(128) NOT NULL,
  `each` int(11) NOT NULL DEFAULT 1,
  PRIMARY KEY (`id`),
  UNIQUE KEY `file_name` (`file_name`)
) ENGINE=InnoDB AUTO_INCREMENT=25508473 DEFAULT CHARSET=latin1 COLLATE=latin1_swedish_ci;
SHOW CREATE TABLE ts_max_date;
CREATE TABLE `ts_max_date` (
  `id` int(11) NOT NULL AUTO_INCREMENT,
  `id_mysql_server` int(11) NOT NULL,
  `date` datetime DEFAULT NULL,
  `sample_epoch` bigint(20) unsigned NOT NULL DEFAULT 0,
  `date_p1` datetime DEFAULT NULL,
  `sample_epoch_p1` bigint(20) unsigned NOT NULL DEFAULT 0,
  `date_p2` datetime DEFAULT NULL,
  `sample_epoch_p2` bigint(20) unsigned NOT NULL DEFAULT 0,
  `date_p3` datetime DEFAULT NULL,
  `sample_epoch_p3` bigint(20) unsigned NOT NULL DEFAULT 0,
  `date_p4` datetime DEFAULT NULL,
  `sample_epoch_p4` bigint(20) unsigned NOT NULL DEFAULT 0,
  `id_ts_file` int(11) NOT NULL,
  `last_date_listener` datetime DEFAULT current_timestamp(),
  `last_sample_epoch_listener` bigint(20) unsigned NOT NULL DEFAULT 0,
  PRIMARY KEY (`id`),
  UNIQUE KEY `id_mysql_server_2` (`id_mysql_server`,`id_ts_file`),
  UNIQUE KEY `id_mysql_server` (`id_mysql_server`,`id_ts_file`,`date`),
  UNIQUE KEY `date` (`date`,`id_ts_file`,`id_mysql_server`),
  KEY `id_ts_file` (`id_ts_file`),
  KEY `id_mysql_server_4` (`id_mysql_server`,`date`),
  KEY `date_2` (`date`,`last_date_listener`),
  CONSTRAINT `ts_max_date_ibfk_3` FOREIGN KEY (`id_ts_file`) REFERENCES `ts_file` (`id`)
) ENGINE=InnoDB AUTO_INCREMENT=22859 DEFAULT CHARSET=utf8mb4 COLLATE=utf8mb4_general_ci;
SHOW CREATE TABLE mysql_server;
CREATE TABLE `mysql_server` (
  `id` int(11) NOT NULL AUTO_INCREMENT,
  `is_deleted` tinyint(1) NOT NULL DEFAULT 0,
  `created_at` datetime NOT NULL DEFAULT current_timestamp(),
  `updated_at` datetime NOT NULL DEFAULT current_timestamp() ON UPDATE current_timestamp(),
  `id_client` int(11) NOT NULL,
  `id_environment` int(11) NOT NULL,
  `name` varchar(100) CHARACTER SET utf8mb3 COLLATE utf8mb3_general_ci NOT NULL,
  `display_name` varchar(100) NOT NULL,
  `ip` varchar(255) CHARACTER SET latin1 COLLATE latin1_bin NOT NULL,
  `hostname` varchar(200) NOT NULL DEFAULT '',
  `login` varchar(32) CHARACTER SET utf8mb3 COLLATE utf8mb3_general_ci NOT NULL,
  `passwd` varchar(255) CHARACTER SET latin1 COLLATE latin1_bin NOT NULL,
  `database` varchar(64) NOT NULL,
  `is_password_crypted` int(11) NOT NULL,
  `is_ssl` int(11) NOT NULL DEFAULT 0,
  `port` int(11) NOT NULL,
  `ssh_nat` varchar(64) CHARACTER SET latin1 COLLATE latin1_bin NOT NULL DEFAULT '',
  `ssh_port` int(11) NOT NULL DEFAULT 22,
  `ssh_login` text CHARACTER SET latin1 COLLATE latin1_bin NOT NULL DEFAULT '\'\'',
  `is_sudo` int(11) NOT NULL DEFAULT 0,
  `is_root` int(11) NOT NULL DEFAULT 1,
  `is_monitored` int(11) NOT NULL DEFAULT 1,
  `monitoring_disabled_reason` enum('manual','license_quota') DEFAULT NULL,
  `is_proxy` int(11) NOT NULL DEFAULT 0,
  `is_vip` tinyint(1) NOT NULL DEFAULT 0,
  `is_binlog_relay` tinyint(1) NOT NULL DEFAULT 0,
  `is_clickhouse` tinyint(1) NOT NULL DEFAULT 0,
  `errant_gtid_set` text DEFAULT NULL COMMENT '#1280 P0.1 last computed errant GTID set (canonical form, empty string = no errant)',
  `is_acknowledged` int(11) NOT NULL DEFAULT 0,
  `timeout` int(11) GENERATED ALWAYS AS (case when `is_proxy` = 1 then 11 else 1 end) VIRTUAL,
  `errant_gtid_sampled_at` datetime DEFAULT NULL COMMENT '#1280 P0.1 wall-clock of the last successful errant-set computation',
  `errant_gtid_ignore` tinyint(1) NOT NULL DEFAULT 0,
  `replica_lag_sla_seconds` int(11) NOT NULL DEFAULT 30,
  `is_out_of_service` tinyint(1) NOT NULL DEFAULT 0 COMMENT 'operator-flagged HS for reload from master',
  PRIMARY KEY (`id`),
  UNIQUE KEY `name` (`name`),
  UNIQUE KEY `ip` (`ip`,`port`),
  KEY `id_client` (`id_client`),
  KEY `id_environment` (`id_environment`),
  KEY `is_monitored` (`id_client`,`is_monitored`,`is_deleted`) USING BTREE,
  KEY `is_deleted` (`is_deleted`)
) ENGINE=InnoDB AUTO_INCREMENT=337 DEFAULT CHARSET=utf8mb4 COLLATE=utf8mb4_general_ci WITH SYSTEM VERSIONING
 PARTITION BY SYSTEM_TIME
PARTITIONS 2;
SHOW CREATE TABLE ts_value_general_int;
CREATE TABLE `ts_value_general_int` (
  `date` datetime NOT NULL,
  `id_ts_variable` int(11) NOT NULL,
  `id_mysql_server` int(11) NOT NULL,
  `value` bigint(20) unsigned DEFAULT NULL,
  PRIMARY KEY (`date`,`id_ts_variable`,`id_mysql_server`),
  KEY `id_mysql_server` (`id_mysql_server`,`id_ts_variable`,`date`)
) ENGINE=ROCKSDB DEFAULT CHARSET=latin1 COLLATE=latin1_swedish_ci
 PARTITION BY RANGE (to_days(`date`))
(PARTITION `p740279` VALUES LESS THAN (740279) ENGINE = ROCKSDB,
 PARTITION `p740280` VALUES LESS THAN (740280) ENGINE = ROCKSDB,
 PARTITION `p740281` VALUES LESS THAN (740281) ENGINE = ROCKSDB,
 PARTITION `p740282` VALUES LESS THAN (740282) ENGINE = ROCKSDB,
 PARTITION `p740283` VALUES LESS THAN (740283) ENGINE = ROCKSDB,
 PARTITION `p740284` VALUES LESS THAN (740284) ENGINE = ROCKSDB,
 PARTITION `p740285` VALUES LESS THAN (740285) ENGINE = ROCKSDB,
 PARTITION `p740286` VALUES LESS THAN (740286) ENGINE = ROCKSDB,
 PARTITION `p740287` VALUES LESS THAN (740287) ENGINE = ROCKSDB,
 PARTITION `p740288` VALUES LESS THAN (740288) ENGINE = ROCKSDB,
 PARTITION `p740289` VALUES LESS THAN (740289) ENGINE = ROCKSDB,
 PARTITION `p740290` VALUES LESS THAN (740290) ENGINE = ROCKSDB,
 PARTITION `p740291` VALUES LESS THAN (740291) ENGINE = ROCKSDB,
 PARTITION `p740292` VALUES LESS THAN (740292) ENGINE = ROCKSDB,
 PARTITION `p740293` VALUES LESS THAN (740293) ENGINE = ROCKSDB,
 PARTITION `p740294` VALUES LESS THAN (740294) ENGINE = ROCKSDB,
 PARTITION `p740295` VALUES LESS THAN (740295) ENGINE = ROCKSDB,
 PARTITION `p740296` VALUES LESS THAN (740296) ENGINE = ROCKSDB,
 PARTITION `p740297` VALUES LESS THAN (740297) ENGINE = ROCKSDB,
 PARTITION `p740298` VALUES LESS THAN (740298) ENGINE = ROCKSDB,
 PARTITION `p740299` VALUES LESS THAN (740299) ENGINE = ROCKSDB,
 PARTITION `p740300` VALUES LESS THAN (740300) ENGINE = ROCKSDB,
 PARTITION `p740301` VALUES LESS THAN (740301) ENGINE = ROCKSDB,
 PARTITION `p740302` VALUES LESS THAN (740302) ENGINE = ROCKSDB,
 PARTITION `p740303` VALUES LESS THAN (740303) ENGINE = ROCKSDB,
 PARTITION `p740304` VALUES LESS THAN (740304) ENGINE = ROCKSDB,
 PARTITION `p740305` VALUES LESS THAN (740305) ENGINE = ROCKSDB,
 PARTITION `p740306` VALUES LESS THAN (740306) ENGINE = ROCKSDB,
 PARTITION `p740307` VALUES LESS THAN (740307) ENGINE = ROCKSDB,
 PARTITION `p740308` VALUES LESS THAN (740308) ENGINE = ROCKSDB,
 PARTITION `p740309` VALUES LESS THAN (740309) ENGINE = ROCKSDB,
 PARTITION `p740310` VALUES LESS THAN (740310) ENGINE = ROCKSDB);
The collector change
The ts_variable unique index is called name and covers (name, from). Several sources may use the same metric name, while the pair used here identifies at most one row. The writer already knew the source. The reader filtered by name, type and radical, but omitted the source. The deployed reader now uses it. Here is the MySQL availability path with a parameter for the server ID.
SELECT t.value AS previous_value
FROM ts_max_date AS m
JOIN ts_file AS f ON f.id = m.id_ts_file
JOIN ts_variable AS v ON v.id_ts_file = f.id
  AND v.name = 'mysql_available'
  AND v.`from` = 'mysql_server'  /* + */
  AND v.type = 'INT' AND v.radical = 'general'
JOIN mysql_server AS s ON s.id = m.id_mysql_server
  AND s.is_deleted = 0
LEFT JOIN ts_value_general_int AS t
  ON t.id_mysql_server = m.id_mysql_server
 AND t.id_ts_variable = v.id
 AND t.date = m.date
WHERE m.id_mysql_server = ? AND f.file_name = 'mysql_server'
LIMIT 1;
The annotated line is the only addition. Here from is a column name quoted with backticks. Its value on this path is mysql_server. Other collectors supply their own source. The index already existed at deployment.
The source distinguishes just 32 more groups across 3,791 rows
We grouped the 3,791 rows in ts_variable in a single read-only snapshot on 21 November 2026 at 21:25 CET. The percentage below is the number of distinct groups divided by the table’s row count.
| Grouped columns | Exact groups | Groups / rows | SHOW INDEX before → after |
|---|---|---|---|
(name) |
3,759 | 99.16% | 3,841 → 3,840 |
(name, from) |
3,791 | 100% | 3,841 → 3,840 |
(from) |
42 | 1.11% | 42 → 42 |
The first two rows are successive prefixes of the unique index named name. The third uses the separate index on from. At the initial reading, MariaDB reported 3,841 at both positions of the unique index. This statistic is an estimate and can exceed the actual row count. MariaDB cardinality reference.
The counts explain that initial expectation. 3,729 names occur once, 28 twice and 2 three times. Grouping by (name, from) adds only 32 groups across the entire table. The ratio of distinct groups to rows rises from 99.16% to 100%, just 0.84 percentage points. For the availability metric, even that small difference disappears. The name mysql_available matches one row, and specifying the source matches the same row.
SELECT rows_per_name, COUNT(*) AS number_of_names
FROM (
    SELECT name, COUNT(*) AS rows_per_name
    FROM ts_variable
    GROUP BY name
) AS names
GROUP BY rows_per_name
ORDER BY rows_per_name;
After refreshing statistics for ts_variable
At 21:30 CET, ANALYZE NO_WRITE_TO_BINLOG TABLE pmacontrol.ts_variable returned OK on the monitored instance. SHOW INDEX went from 3,841 to 3,840 for both prefixes. Repeating the group counts immediately afterwards gave the same exact cardinalities.
InnoDB records prefix estimates in mysql.innodb_index_stats. For the name index, n_diff_pfx01 went from 3,757 to 3,759 and n_diff_pfx02 from 3,789 to 3,791. Both now match the exact counts. Before and after the refresh, EXPLAIN estimated one row for each isolated lookup on ts_variable. Access remained ref for the name and const for the pair.
Counting queries and raw results (ZIP)
Execution plans side by side
Originally MariaDB used the name index with ref access on the first column. With both equalities in place it can resolve the entire unique key, giving const access to v. The recorded plans use 102 and 168 key bytes respectively. The lookup of t also changes from eq_ref to const on its primary key. Rows examined per call fall from about three to one across the whole statement. MariaDB can establish uniqueness before proceeding with the joins.
Each cell shows the join position, access type, chosen index and key length in bytes. Rows are aligned by table.
| Table | Before | After |
|---|---|---|
ts_file (f) |
1 · const · file_name · 130 B |
1 · const · file_name · 130 B |
ts_max_date (m) |
2 · const · id_mysql_server_2 · 8 B |
3 · const · id_mysql_server_2 · 8 B |
ts_variable (v) |
3 · ref · name · 102 B |
2 · const · name · 168 B |
mysql_server (s) |
4 · ref · PRIMARY · 4 B |
5 · ref · PRIMARY · 4 B |
ts_value_general_int (t) |
5 · eq_ref · PRIMARY · 13 B |
4 · const · PRIMARY · 13 B |
In both plans, MariaDB estimates one row for each of the five tables and lists the same 32 partitions for ts_value_general_int.
Full plan before (CSV) · Full plan after (CSV)
Where the time changed
| Phase · median across 50 servers | Before | After |
|---|---|---|
| Optimization | 35.085 ms | ✓ 0.261 ms (÷134.27) |
| Execution after optimization | 0.107 ms | 0.011 ms |
Statistics stage |
54.983 ms | ✓ 0.224 ms (÷245.46) |
The first two rows come from ANALYZE FORMAT=JSON. The Statistics row comes from a separate SHOW PROFILE run. These timings were collected separately.
With name alone, MariaDB estimates that it will read one row. With both equalities, the unique index on (name, from) guarantees at most one match. MariaDB can therefore treat v.id as a constant while planning the join to the values table. Across 50 servers, median planning time fell from 35.085 to 0.261 ms. Execution after planning fell from 0.107 to 0.011 ms. Planning the joins accounted for most of the measured saving.
Cumulative SQL time since deployment
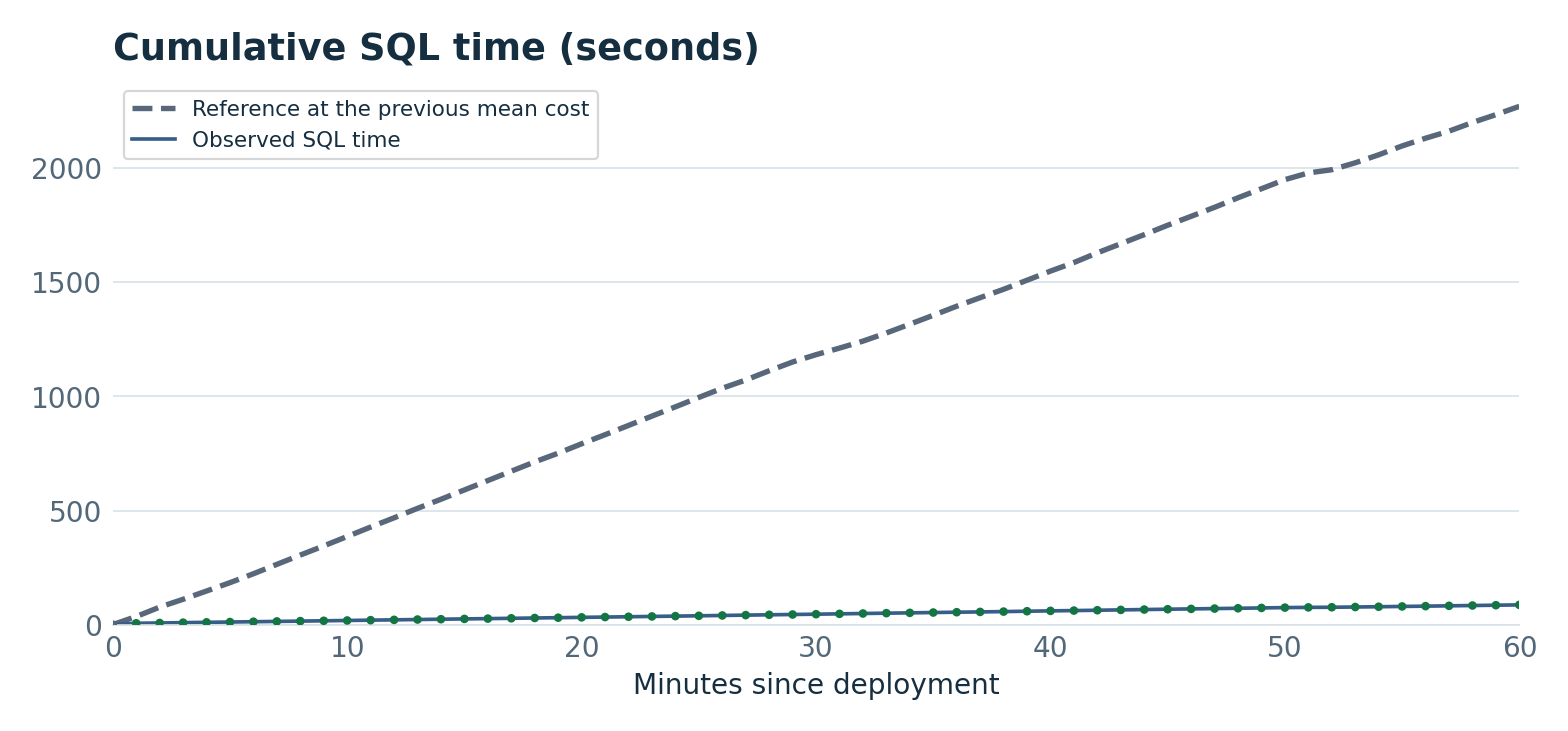
Both curves start at zero at deployment and use the same post-deployment traffic. The solid line accumulates observed time. The reference prices the actual calls at the previous hour’s mean cost. At one hour this gives 86.5 observed seconds against 2,271.4 estimated seconds at the old cost, an estimated 36 min 25 s of SQL time saved. SQL durations can overlap across sessions and include waits. The estimate does not measure CPU minutes.
The 50-server check
On MariaDB 11.8.10 with the query cache disabled, we randomly sampled 50 distinct server IDs from 111 yielding a value. Each pair read the same server in a read-only transaction. The original query ran first in 25 pairs and the revised one first in 25. Timings came from server-side SHOW PROFILES. All 50 results agreed, and the revised query was faster in all 50 pairs.
| Variant | Minimum (ms) | Median (ms) | Mean (ms) | Maximum (ms) |
|---|---|---|---|---|
| Before | 2.159 | 12.543 | 21.686 | 117.530 |
| After | ✓ 0.535 (÷4.03) | ✓ 0.755 (÷16.62) | ✓ 0.804 (÷26.98) | ✓ 2.446 (÷48.05) |
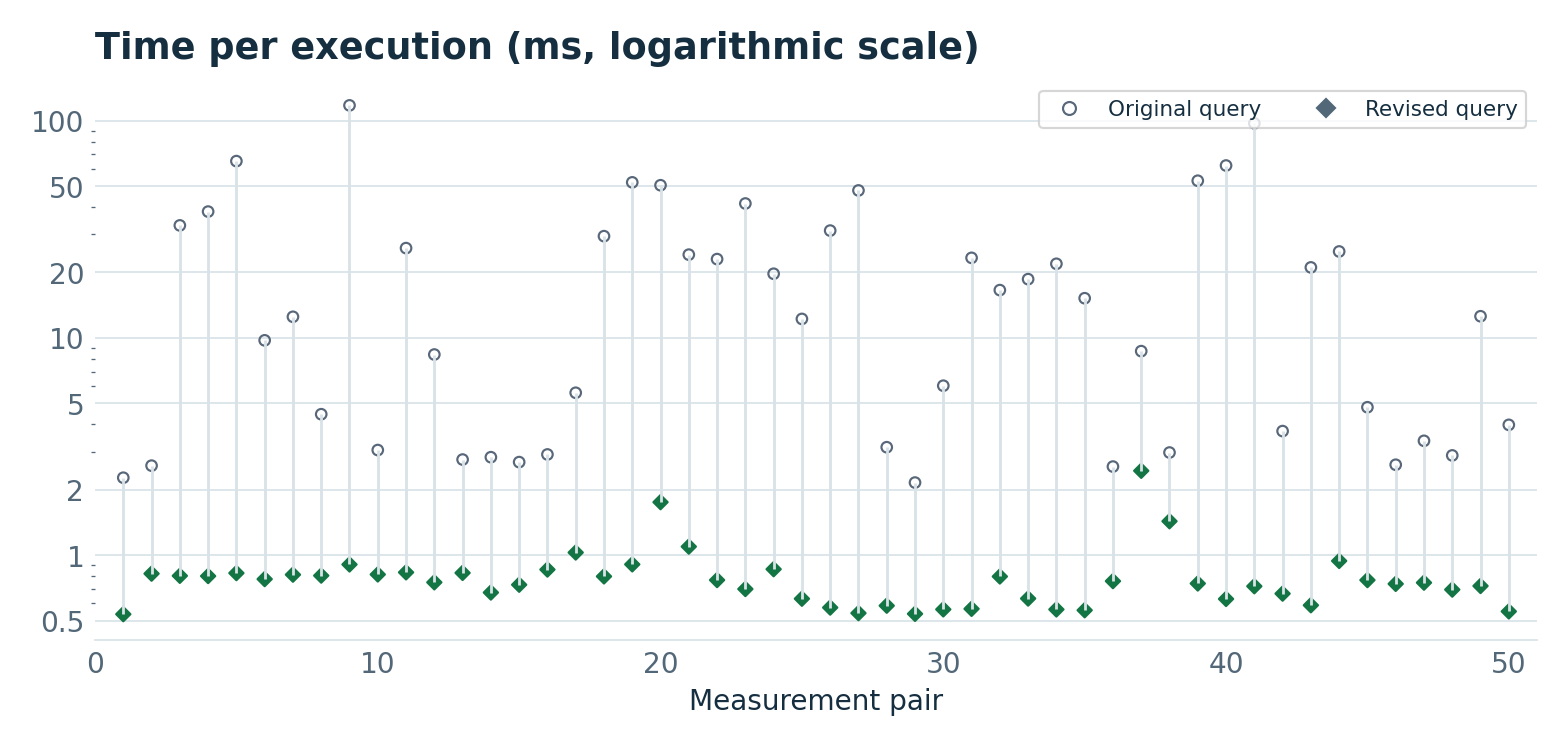
Each column connects two timings for the same server. A logarithmic scale shows both submillisecond values and the 117.53 ms maximum. The ratio of sample means is 26.98. The ratio of weighted means across the production hours is 26.25.
Alternatives compared with the deployed query
Each row compares mean statement times on the same servers in the same experiment. Each series covers 50 servers. The number in parentheses is the execution count per variant.
| Variant | Reference (ms) | Variant (ms) |
|---|---|---|
| Name only (150) | 0.651 | ✗ 36.782 (×56.50) |
| Name only, forced primary key on values (150) | 0.651 | ✗ 1.674 (×2.57) |
| Full key, forced primary key on values (150) | 0.651 | 0.630 |
| Forced covering index on the date table (50) | 0.692 | ✗ 20.232 (×29.25) |
Active server checked with EXISTS (150) |
0.651 | 0.663 |
| Scalar lookup of the value (150) | 0.617 | 0.546 |
| Forced join order (50) | 0.692 | ✗ 41.737 (×60.34) |
Scalar lookup with EXISTS (150) |
0.617 | 0.563 |
Scalar lookup without LIMIT (150) |
0.617 | 0.560 |
Deployed joins without LIMIT (150) |
0.617 | 0.602 |
| Scalar lookup with name only (150) | 0.617 | 1.218 |
Anonymized variant and phase measurements (ZIP)
How to reproduce the charts
The window runs from 16:26:47 to 18:26:47 Paris time. Bucket boundaries are interpolated between snapshots. The call counters read directly at deployment anchor the transition. We include 496 test calls under the new digest before deployment and 224 final calls under the old digest afterward. A collector restart around 18:17 also affected the end of the volume curve.
For each minute, the change in COUNT_STAR gives the number of calls directly. For mean latency, divide the change in SUM_TIMER_WAIT by the change in COUNT_STAR, then by one billion to convert picoseconds to milliseconds. The hourly mean uses total time and total calls. The paired test isolates the SQL change more closely than two hours of live observation.
Comments (0)
No comments yet.
Leave a comment