 PmaControl
When PmaControl receives the same observation twice, it must recognize the duplicate to avoid opening or closing an incident twice. It used to ask MariaDB for the date of the latest observation and then look up the point it had just received. We removed the first read.
Across five real checks, median SQL read time for replay fell from 6.645 to 0.363 ms, a 95% reduction. In the lab, the median for the complete transaction, including locking and writes, fell from 2.554 to 0.904 ms. The application patch has been tested and awaits deployment.
The time-zone check, query by query
At 22:29:19 on 21 November, the time-zone alignment check reported an alert. What happens if that observation arrives again? The original implementation starts with the query below. The question mark stands for the check’s fingerprint and has the same value in both queries.
EXPLAIN PARTITIONS
SELECT observed_at
FROM pmc_alert_level_point
WHERE fingerprint = UNHEX(?)
ORDER BY observed_epoch DESC, observed_at DESC
LIMIT 1;
The caller used the presence of a row to decide whether history existed. It then looked up the exact observation and read its state. The chosen implementation starts here. A matching point and state identify a replay. A conflicting state at the same instant raises an error.
EXPLAIN PARTITIONS
SELECT is_open
FROM pmc_alert_level_point
WHERE fingerprint = UNHEX(?)
  AND observed_epoch = 1795296559
  AND observed_at = '2026-11-21 22:29:19.000000';
Plans captured on the server for this check. The first result column shows the removed read. The second shows the read that suffices for replay.
| EXPLAIN PARTITIONS | Latest date | Exact point |
|---|---|---|
Access (type) |
range |
const |
Index (key) |
PRIMARY |
PRIMARY |
Key bytes (key_len) |
32 | 48 |
Reference (ref) |
— | const,const,const |
Estimated rows (rows) |
8,617 | 1 |
| Partitions in plan | 45 | 1 (p740307) |
| Extra | Using where; Using index |
— |
Both queries use PRIMARY. The first fixes the 32-byte fingerprint and leaves 45 partitions in the plan. The second also fixes the epoch and date, covering all 48 bytes of the key. MariaDB can locate one key in the partition for that day.
The 8,617 in rows is an estimate. In ANALYZE FORMAT=JSON, the first query’s iterator returned one row (r_rows = 1, r_loops = 1), consistent with LIMIT 1. These counters do not measure internal partition probes. From 19 to 21 November the digest recorded 1,643,071 calls and 8 hours 8 minutes of cumulative SQL time.
Open all 20 MariaDB plans for the five checks (text)
The five checks in the benchmark
The digest page showed five executions of the same SQL with five different fingerprint values. Each value identifies one monitored condition. We recovered its rule name from the corresponding observation. The letters in parentheses are the identifiers used in the CSV files.
| Check (CSV key) | Rule code | Alerting points / total |
|---|---|---|
| Performance Schema enabled (A) | AdvisorPerformanceSchema |
0 / 5,692 |
| Time-zone alignment (B) | AdvisorTimeZoneAlignment |
5,694 / 5,695 |
| Galera state transfer method (SST) (C) | AdvisorWsrepSstMethod |
0 / 5,692 |
| Galera transaction applier threads (D) | AdvisorWsrepSlaveThreads |
0 / 5,692 |
| Galera node name (E) | AdvisorWsrepNodeName |
0 / 5,692 |
All five replayed observations were dated 21 November at 22:29:19. Only the time-zone check was in alarm at that instant. Each line in the chart joins the original median to the median for the read path that starts with the exact point.
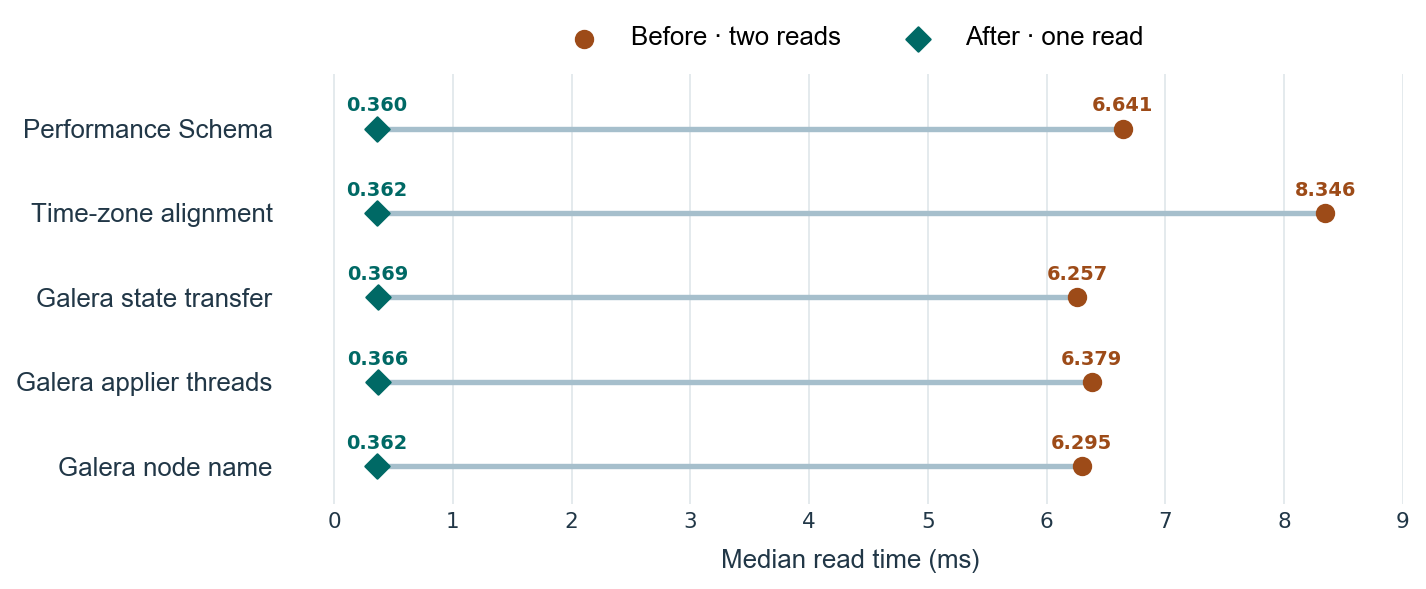
Each check ran 50 times per version on the observed server. The last row pools all 250 measurements for each version. Both tables show SQL time in milliseconds.
Replaying an existing point · two reads down to one
| Check | Mean before | Mean after | Median before | Median after |
|---|---|---|---|---|
| Performance Schema enabled | 7.171 | 0.372 | 6.641 | 0.360 |
| Time-zone alignment | 8.808 | 0.400 | 8.346 | 0.362 |
| Galera state transfer method (SST) | 7.372 | 0.575 | 6.257 | 0.369 |
| Galera transaction applier threads | 6.970 | 0.389 | 6.379 | 0.366 |
| Galera node name | 7.132 | 0.374 | 6.295 | 0.362 |
| All five checks | 7.491 | 0.422 | 6.645 | 0.363 |
Adding a point to existing history · four reads down to three
| Check | Mean before | Mean after | Median before | Median after |
|---|---|---|---|---|
| Performance Schema enabled | 39.832 | 29.522 | 29.189 | 26.465 |
| Time-zone alignment | 41.518 | 32.461 | 35.533 | 29.123 |
| Galera state transfer method (SST) | 39.431 | 31.138 | 31.509 | 28.157 |
| Galera transaction applier threads | 36.855 | 31.667 | 33.790 | 25.943 |
| Galera node name | 39.696 | 31.043 | 35.195 | 28.511 |
| All five checks | 39.466 | 31.166 | 33.243 | 27.975 |
Why appending a point saves less time
A late observation can fall between two retained points and change an incident’s boundaries. On an exact-key miss the application therefore looks up the preceding and following points in (observed_epoch, observed_at) order. Finding either neighbor also proves that history exists.
These are the time-zone check’s two neighbor plans for the append parameter, dated 22 November at 22:29:19. Both reads still contribute to the cost after the latest-date query is removed.
| Neighbor | Access | Index | Partitions | Estimated rows |
|---|---|---|---|---|
| Predecessor | range |
PRIMARY |
45 | 8,653 |
| Successor | range |
PRIMARY |
45 | 81 |
V1 is the original implementation. V2 removes the latest-date lookup and uses the exact point and its neighbors. If all three reads miss, it checks for state left by a previous installation. In the first campaign, median restoration time rose from 9.665 to 12.963 ms because V2 searched for neighbors in a ledger it had just found empty.
V3, the chosen implementation, handles that case directly. When the ledger is empty and there is no legacy incident, it restores the single saved healthy point with its date, epoch and payload. It then checks the incoming point under the same lock.
Complete lab transaction, mean / median in milliseconds. The PHP timer includes lock acquisition, reads, writes, COMMIT and lock release.
| Operation | V1 · original | V2 · probe removed | V3 · direct restoration |
|---|---|---|---|
| Replay a known point | 3.954 / 2.554 | 1.586 / 0.924 | 1.518 / 0.904 |
| Append to existing history | 23.907 / 17.297 | 23.516 / 13.954 | 22.895 / 14.017 |
| Create the first point | 28.373 / 10.477 | 20.031 / 8.689 | 22.708 / 8.660 |
| Restore one legacy healthy point | 23.609 / 10.422 | 29.137 / 13.423 | 17.151 / 7.916 |
The largest difference between V2 and V3 is in restoration. Their append medians are close. All three produced identical decisions, points, incidents, intervals and last states.
Can fingerprint be the primary key?
On 20 November we counted 543,719 points for 9,478 fingerprints. One fingerprint occurred 83 times that day. The fingerprint identifies a check. The triplet (fingerprint, observed_epoch, observed_at) identifies one observation of that check.
SHOW INDEX estimated 3,672,630 distinct values for the first key prefix and 2,448,420 for each longer prefix. Adding a column cannot lower the exact count. The inversion comes from estimates. On the daily-partitioned copy, PRIMARY KEY(fingerprint) raised error 1503 because every unique key must include observed_at. On an unpartitioned copy, a second observation with the same fingerprint raised duplicate-key error 1062. MariaDB · SHOW INDEX · MariaDB · Partitioning
Other ways to test whether history exists
Times cover all five checks. The illustrated plan is for time-zone alignment. An arrow marks the fallback to the full history on a miss. A dash denotes an unpartitioned table. Each series includes its own control.
| Series and query | Access / index | Partitions | Mean / median (ms) |
|---|---|---|---|
| I · Latest date | range / PRIMARY |
45 | 7.577 / 6.660 |
I · Latest date, FORCE INDEX (PRIMARY) |
ref / PRIMARY |
45 | 4.927 / 4.283 |
I · SELECT 1 … LIMIT 1 |
ref / level_neighbour |
45 | 6.361 / 5.434 |
I · SELECT EXISTS(…) |
ref / level_neighbour |
45 | 6.870 / 5.625 |
| I · Verify saved state in history, then fall back | const / PRIMARY + const / PRIMARY → ref / level_neighbour |
— + 45 → 45 | 4.543 / 3.995 |
| II · Latest date | range / PRIMARY |
45 | 6.401 / 5.623 |
| II · Search the observation day, then fall back | ref / level_neighbour_epoch → ref / level_neighbour |
1 → 45 | 3.739 / 3.411 |
| II · Read last state only | const / PRIMARY |
— | 0.277 / 0.257 |
The last-state table alone returned the same date in all 250 comparisons. It can retain state from an older release or outlive points removed by retention. On its own it cannot establish whether history needs rebuilding.
Read the SQL and the plans for every variant (text)
What a time index and partitioning change
To compare table layouts we ran the original ordered query on 621,865 identical points with MariaDB 11.8.10 and MyRocks. The plans are for time-zone alignment. The candidate time index is when_observed(observed_epoch, observed_at).
| Layout | Access / index | Partitions in plan | Mean / median (ms) |
|---|---|---|---|
| Composite key, daily partitions | range / PRIMARY |
45 | 612.119 / 549.937 |
| With added time index | range / PRIMARY |
45 | 637.779 / 525.603 |
| Forced time index | index / when_observed |
45 | 64.429 / 48.306 |
| Unpartitioned table | range / PRIMARY |
— | 14.052 / 7.676 |
| 16 fingerprint partitions | ref / PRIMARY |
1 | 0.786 / 0.410 |
The optimizer kept PRIMARY for all five checks after adding the index. Forcing when_observed yields an index scan in date order until the fingerprint is found. Partitioning by fingerprint narrows the lookup to one of sixteen partitions and requires a different daily retention strategy.
The lab had one CPU and a 96 MiB MyRocks block cache. The baseline median was 1.350 ms on an initial 571,957-point copy and 549.937 ms on the extended copy. The difference between campaigns remains unexplained. These figures compare layouts within a single series. Production latency and migration cost require separate measurements.
Method and downloadable data
We froze the five examples shown together on the digest page. In each of 50 rounds, we shuffled parameter and variant order with a fixed seed, yielding 50 measurements per check and variant, 250 per variant. First runs and latency spikes are included. Server comparisons used read-only snapshots, an inactive query result cache and SHOW PROFILES.
Write transactions ran on separate 45-partition copies with all 28,463 historical keys for the five checks and synthetic alert payloads. Checks also covered late arrivals, a daylight-saving transition, conflicting points and retry after rollback. The archive includes individual measurements, SQL variants and full plans by check.
Download measurements, the five rule names and SQL plans (ZIP)
The choice for PmaControl
Return to the time-zone observation. Over 50 replays, mean read time fell from 8.808 to 0.400 ms, and the median fell from 8.346 to 0.362 ms. The decision depends on the check, the instant and the state already recorded. We keep V3 and the composite primary key for a single replay lookup and a history that can still accept the next point out of order.
Comments (0)
No comments yet.
Leave a comment